


We'll help!

Roundskeeper Overview
It seems that collecting data is a never ending task. Whether it is data that is collected as an automated process from the data highway, or data recorded from a human observation and then set to a 'yellow notepad', data collection is required to maintain a functioning and safe plant environment. RoundsKeeper is a software system that is designed to automate the process of manual data collection. It allows you to eliminate the 'pad and pencil' way of manually collecting data. Your data and observations can be collected and then directly assimilated into a database where it can be trended, archived, or otherwise reported on.
Typically, manually collected data are collected in logically organized units, or 'routes'. These routes are usually named according to the type or class of data that the route contains, such as 'Turbine Log', or 'Outside Route'. A route may be permanently required such as a 'Turbine Log' or 'Water Chemistry' or it may be of a temporary nature such as a 'Vibration Analysis'; i.e., collected and analyzed for two weeks and then disposed of.
A route's data collection points are usually listed in the order that the data are collected. This order may differ however, according to the time the data are collected or who is collecting the data. For example: a 'Turbine Log' may be collected in it's entirety at 08:00, 16:00, and 24:00 but only partially at 04:00,12:00, and 20:00. Also, the order that the route is taken may differ with who is actually collecting the data, or it may differ with the time it is taken.
Although the 'route' is usually the way that data are collected, there may be times when data need to be collected that is not associated with any particular route. For example, a data point that is not normally collected or observed may need to be scrutinized for only a short period of time, and then after the time period has expired, the data is no longer required.
Data that has been collected either as part of a route or individually retrieved is usually tabulated and organized into a report at the end of a period. A period can be a day, set of days, weeks or months. The data are usually put into a format that makes analysis fairly easy to do. With the aid of programs such as Microsoft Excel or such, the data can be tabulated and quantified, and even trended. However, when this is done, the data needs to be manually transferred to the program which makes it necessary to 'double handle' the data. The necessity to handle the data more than once often-times makes in-depth analysis too labor intensive to bother with, and therefore, it doesn't get done. More often than not, data collected manually gets 'scanned' on the end of a shift report, and then delegated to the filing cabinet never to be seen again.
RoundsKeeper addresses all of these issues, but adds one highly important ability that makes it all worth while; i.e., data collected is extremely easy to retrieve for analysis or reporting. Because retrieving the data is so easy and quick, reporting or trending is done more often, and when this is performed on a regular basis equipment failures can be reduced and costly downtime is minimized.
Data can be collected as a data point which has been defined as part of a 'route' or as an individual data point not part of any route. Routes can be defined and created in RoundsKeeper that can be collected at prescribed times of the day in any number of 'orders' or 'sequences'. Particular data collection points can be selected for collection making partial routes possible. Once a master route has been created, any number of 'alternate routes' can be created.
Alternate routes make it possible to define a route that will be taken at certain times of the day, and variations of the route that will be taken at other times of the day. For example: a 12PM Turbine route and an alternative version called 12AM Turbine route.
Likewise, different personnel can have their own data collection sequence. Tom can collect the Outside route going clockwise, while Harry can collect the same route going counter-clockwise.
Earlier it was stated that data retrieval was extremely easy in RoundsKeeper. As a matter of fact, to generate a trended chart of your data all you have to do is double-click on the point of interest. All of the data that has been collected is instantly graphed and displayed in a chart which can be viewed in either 2D or 3D format. The type of chart and colors can also be changed to suite your requirements. Then, when you are satisfied with the results, the chart can be printed to the printer of your choice or saved to a file where it can be emailed or archived.
Multiple data points can also be selected for stacked charts. This is extremely handy if you need to evaluate how two or more data points interact with each other. For example: you could trend and correlate bearing temperature against vibration.
Back to Top
Trending
| Simply by double-clicking a data collection device in the route grid will cause that point to be trended in a user-configured chart. | 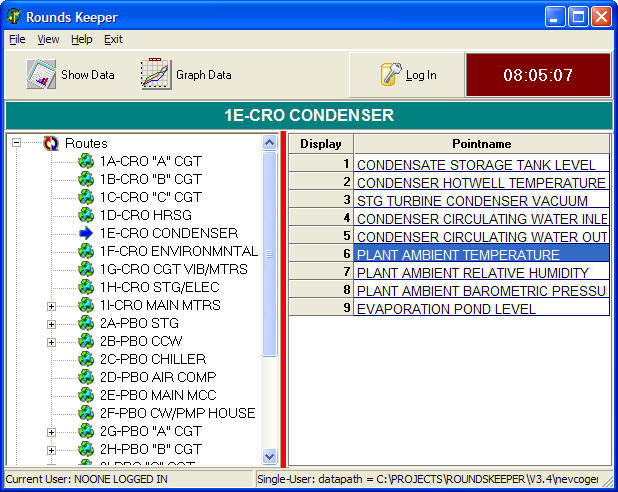 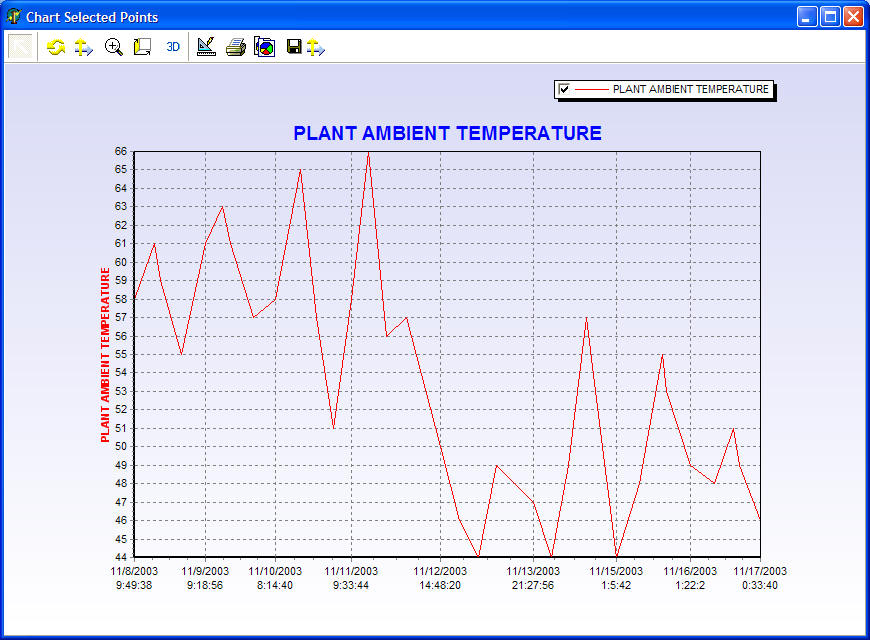 click for larger view |
| Multiple points can be charted automatically by clicking on several points. This method is great for observing relations and cause and effect. | 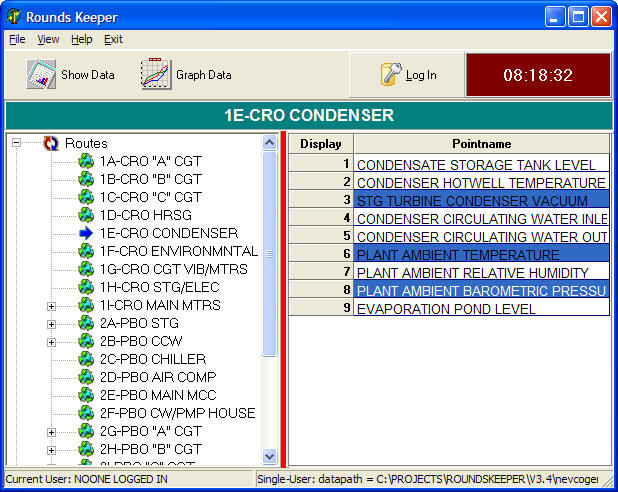 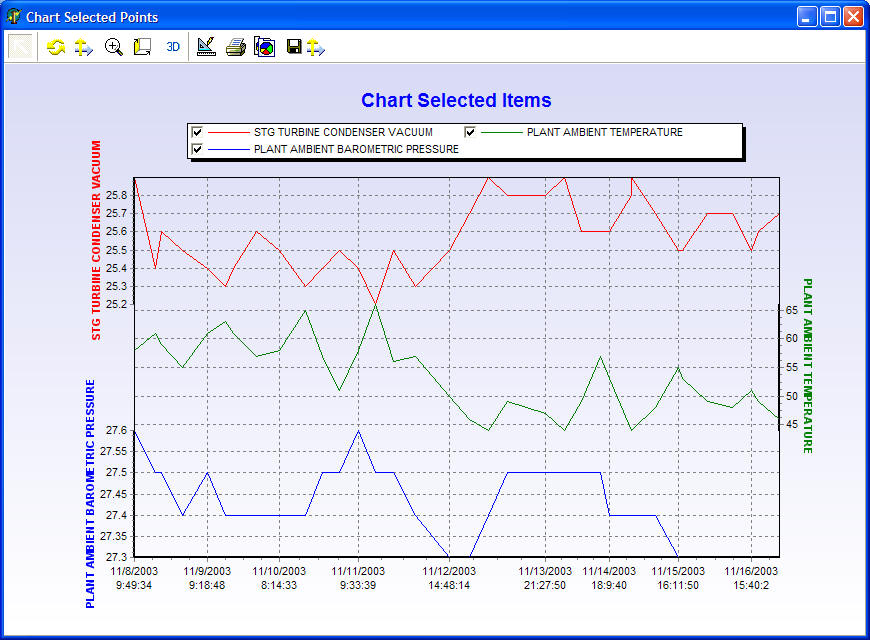 click for larger view |
| Automatic trending reports can be created by selecting the route, showing the route data in the review grid with multiple batches, and then selecting to print the trend report. | 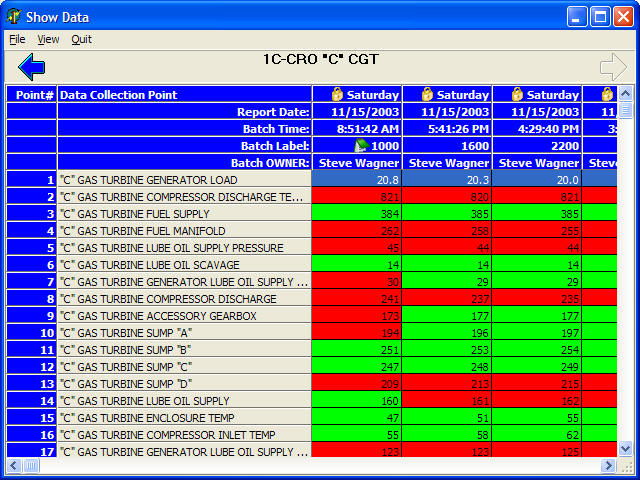 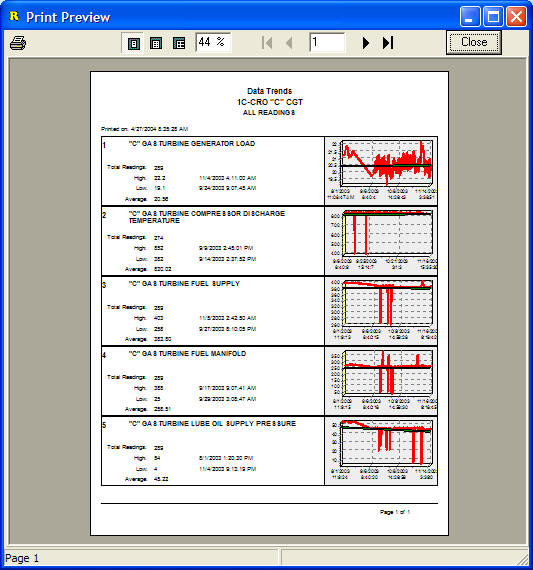 click for larger view |
| Charts can be edited that allows the user to select colors or chart types that better show the selected data. | 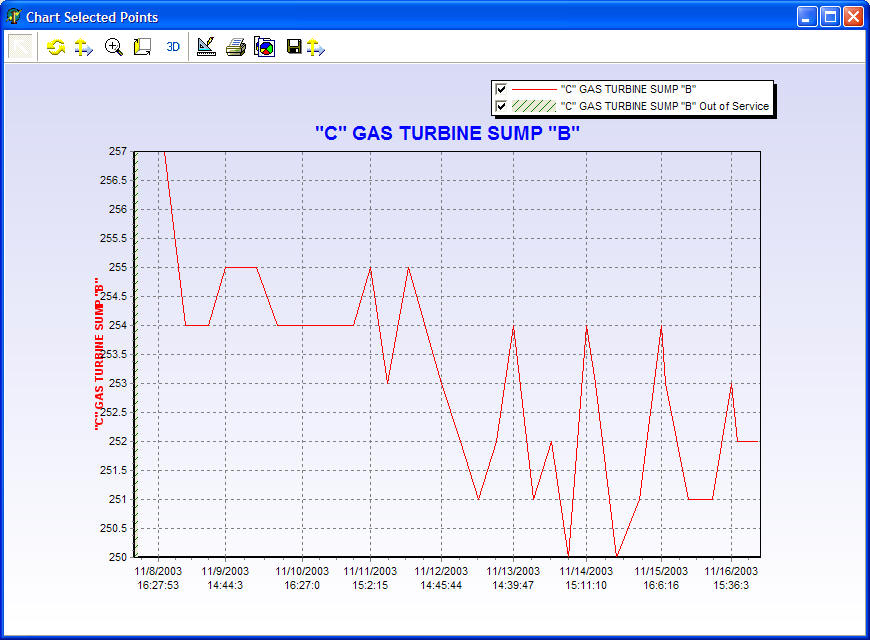 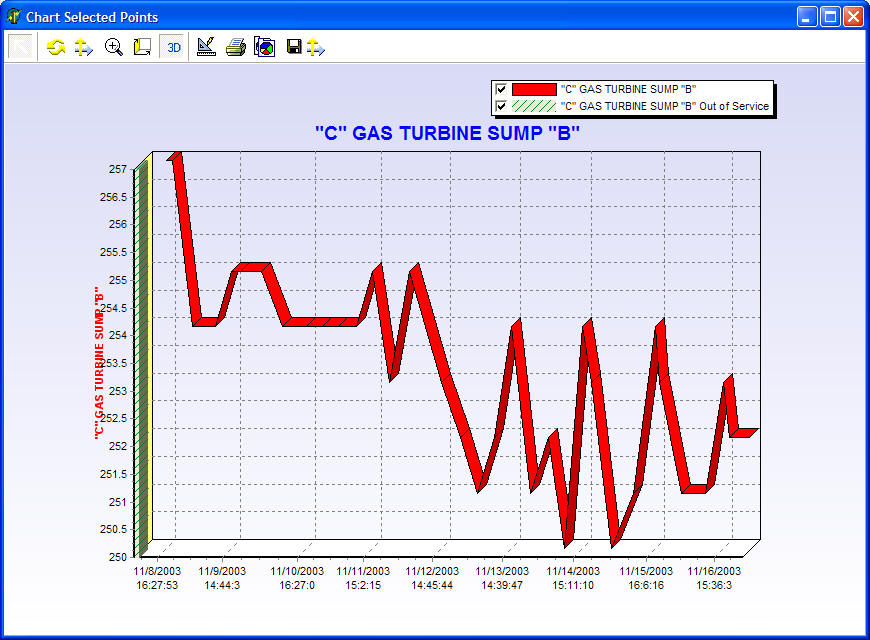 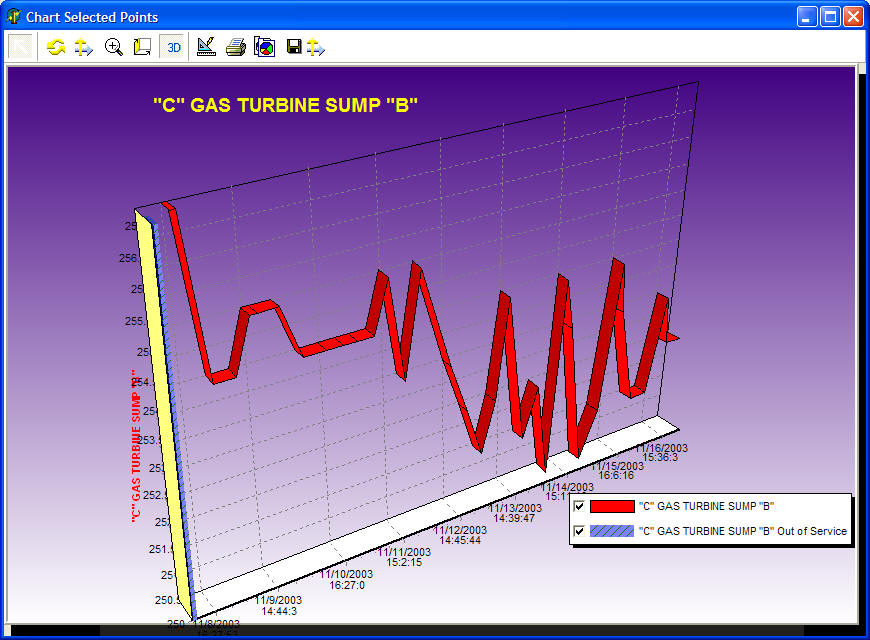 click for larger view |
Reporting
Roundskeeper has a built-in forms designer which makes it easy for you to design reports that can display results from data that have been collected or from calculations. Collected data or calculations from any reporting date or date range can easily be designed into your reports. Report definitions can be saved and reprinted for any reporting date. Any number of reporting definitions can be saved.
Back to Top